Java code to create "git graph" images (targeting mainly the Diagrams.net (*.drawio file) output format and supporting Mermaid (*.mmd file) and Graphviz (*.dot file) outputs as well).
URLs
-
Project home (this page)
| Do you want to improve this page? Please view on GitHub. |
Motivation
Drawing Git Diagram is very important to explain a branching model, or how a tool works, or the required commits during a release process.
Drawing such diagrams manually is really boring. Especially when you need multiple steps of the same git diagram: you often need to redo the same modifications (like changing a color or a label) on multiple pictures.
The Diagrams.net (formally Draw.io) project has shared an article about how to draw a git flow diagram.
This project automates the creation of such a diagram. Instead of drawing you defines your commits and the branches you would like to have and you generate the picture.
In addition the tool also supports additional outputs than draw.io.
Examples page
Check the examples page to see different possibilities and different outputs.
Usage
The code shared in this project is a prototype more than a real library.
To use it, the best is to have a look at the tests that creates the images in the view on GitHub folder.
Java code to create a diagram:
// create commits:
Commit commitA = new Commit("a");
Commit commitB = new Commit("b").parent(commitA);

Commit commitF = new Commit("f").parent(commitA);
Commit commitG = new Commit("g").parent(commitF);
Commit commitH = new Commit("h").parent(commitG);

Commit commitU = new Commit("u").parent(commitB);
Commit commitV = new Commit("v").parent(commitU);

Commit commitC = new Commit("c", Color.RED)
        .parent(commitH)
        .parent(commitB);
Commit commitD = new Commit("d")
        .parent(commitC)
        .parent(commitV);

// add commits to branches:
Branch branchMain = new Branch("main", Color.BLUE);
branchMain.addCommit(commitA);
branchMain.addCommit(commitB);
branchMain.addCommit(commitC);
branchMain.addCommit(commitD);

Branch branch1 = new Branch("feature_1", Color.GRAY);
branch1.addCommit(commitF);
branch1.addCommit(commitG);
branch1.addCommit(commitH);

Branch branch2 = new Branch("feature_2", Color.YELLOW);
branch2.addCommit(commitU);
branch2.addCommit(commitV);

// add branches to diagram:
Diagram d = new Diagram("diag06");
d.addBranch(branch1);
d.addBranch(branchMain);
d.addBranch(branch2);

// convert to file
String drawIoXmlContent = CreateDiagram.convertToDrawIoXml(d);
Files.write(drawIoFile, drawIoXmlContent.getBytes(StandardCharsets.UTF_8));
Drawio
Out of this the tool is computing the drawio source xml which can then be turn into a svg or a png picture:
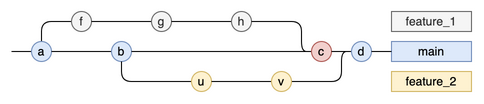
This is the primary target output of the tool.
Mermaid JS
Mermaid JS has a module specialized in drawing git graphs.
The graph corresponding to the previous example would be:
%%{init: { 'logLevel': 'debug', 'theme': 'base', 'gitGraph': {'showBranches': true, 'showCommitLabel':true, 'mainBranchOrder': 1}} }%%
gitGraph
     commit id:"a"
     branch feature_1 order: 0
     branch feature_2 order: 2
     checkout feature_1
     commit id:"f"
     checkout main
     commit id:"b"
     checkout feature_1
     commit id:"g"
     checkout feature_2
     commit id:"u"
     checkout feature_1
     commit id:"h"
     checkout feature_2
     commit id:"v"
     checkout main
     merge feature_1
     merge feature_2
Which is rendered like this:
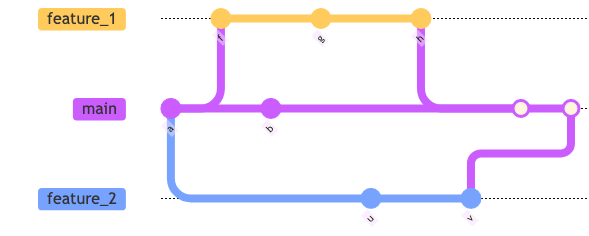
Not everything that can be defined in the Java code is properly mapped to the mermaid syntax
Dot / Graphviz
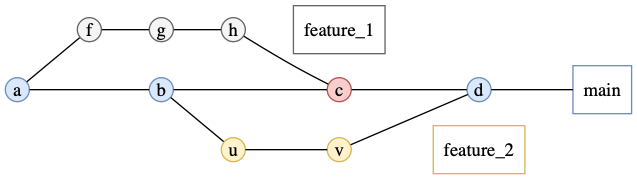
The git graph can be turned into a Graphviz file (*.gv), written using the DOT description language
The graph corresponding to the previous example would be:
digraph G {
    rankdir="LR";
    bgcolor="white"
    node[shape=circle; style=filled; fixedsize=true; width=0.25, fontcolor=black, label=""];
    edge[weight=2, arrowhead=none, color=black];

    node[group="gbox1", color="#666666"; fillcolor="#f5f5f5";];
    f [label="f"];
    g [label="g"];
    h [label="h"];
    box1[shape=box; style=""; fixedsize=false; label="feature_1"];

    node[group="gbox2", color="#6c8ebf"; fillcolor="#dae8fc";];
    a [label="a"];
    b [label="b"];
    c [label="c", color="#b85450", fillcolor="#f8cecc"];
    d [label="d"];
    box2[shape=box; style=""; fixedsize=false; label="main"];

    node[group="gbox3", color="#d6b656"; fillcolor="#fff2cc";];
    u [label="u"];
    v [label="v"];
    box3[shape=box; style=""; fixedsize=false; label="feature_2"];

    a -> f
    a -> b
    f -> g
    b -> u
    g -> h
    u -> v
    h -> c
    b -> c
    c -> d
    v -> d
    h -> box1 [style=invis]
    d -> box2
    v -> box3 [style=invis]
}
Which is rendered like this:
Control commits order
Sometimes you want to control the commits order. In this case it is better to add the commits directly to the diagram:
// create commits:
Commit commitA = new Commit("a");
Commit commitB = new Commit("b").parent(commitA);

Commit commitF = new Commit("f").parent(commitA);
Commit commitG = new Commit("g").parent(commitF);
Commit commitH = new Commit("h").parent(commitG);

Commit commitU = new Commit("u").parent(commitB);
Commit commitV = new Commit("v").parent(commitU);

Commit commitC = new Commit("c", Color.RED)
        .parent(commitH)
        .parent(commitB);
Commit commitD = new Commit("d")
        .parent(commitC)
        .parent(commitV);

// create diagram and branches:
Diagram d = new Diagram("diag06");
Branch branchMain = new Branch("main", Color.BLUE);
Branch branch1 = new Branch("feature_1", Color.GRAY);
Branch branch2 = new Branch("feature_2", Color.YELLOW);

// add branches to diagram (can be omitted if you do not care about the vertical order of the branches):
d.addBranch(branch1);
d.addBranch(branchMain);
d.addBranch(branch2);

// add commits to diagram in order:
d.addCommit(commitA, branchMain);
d.addCommit(commitF, branch1);
d.addCommit(commitB, branchMain);
d.addCommit(commitG, branch1);
d.addCommit(commitU, branch2);
d.addCommit(commitH, branch1);
d.addCommit(commitV, branch2);
d.addCommit(commitC, branchMain);
d.addCommit(commitD, branchMain);
When the diagram holds all the commits (no other commits added only on one of the contained branches), then no algorithm to sort the commits is applied.
Download
The code is not hosted on maven central. If you want to use it, the best option is to clone the repo and to run it locally.
Get in touch
Use the GitGraph4J issue tracker on GitHub.
You can also contact me on Twitter: @j2r2b